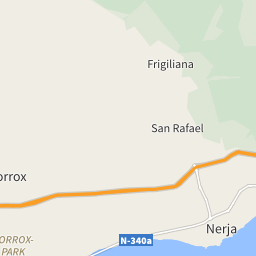
Housing price in the Chaparil-Torrecilla-Punta Lara area, Nerja
The map shows the average prices of the residential properties in the area Chaparil-Torrecilla-Punta Lara in Nerja. The reference period is December 2024.
sale
3,645 €/m²
-
rent
11.85 €/m²
-
Or rely on the experience of a real estate agency
Search agencyProperty prices trend in the zone Chaparil-Torrecilla-Punta Lara
The following charts show price trends over time for all types of residential property in the Chaparil-Torrecilla-Punta Lara area, both for sale and for rent.
In December 2024 the average price asked for residential properties for sale was € 3,645 per square meter, with an increase of 8.32% compared to March 2024 (3,365 €/m²). Over the past 2 years, the average price in the Chaparil-Torrecilla-Punta Lara area reached its peak in the month of October 2024, with a value of € 3,655 per square meter. The month with the lowest asking price was May 2023: for a property for sale, the average price asked was € 3,039 per square meter.
In December 2024 the average price asked for residential rental properties was € 11.85 per month per square meter, with a decrease of 2.15% compared to March 2024 (€ 12.11 monthly per square meter). Over the past 2 years, the average price in the Chaparil-Torrecilla-Punta Lara area reached its peak in the month of March 2024, with a value of € 12.11 per square meter. The month with the lowest asking price was June 2023: for a rental property, the average price asked was € 8.73 per month per square meter.