Housing prices in the municipality of San José del Valle
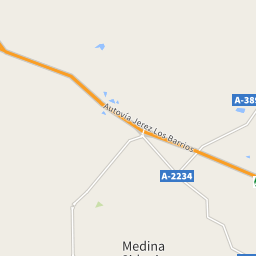
The map shows the average prices of the residential properties in the municipality of San José del Valle. The reference period is December 2024.
sale
1,024 €/m²
from 469 €/m² to 4,409 €/m²
rent
2.69 €/m²
from 2.30 €/m² to 14.10 €/m²
Or rely on the experience of a real estate agency
Search agencyProperty prices trend in San José del Valle
The following charts show price trends over time for all types of residential property in San José del Valle, both for sale and for rent.
In December 2024 the average price asked for residential properties for sale was € 1,024 per square meter, with a decrease of 4.83% compared to January 2024 (1,076 €/m²). Over the past 2 years, the average price in San José del Valle municipality reached its peak in April 2024, with a value of € 1,227 per square meter. The month with the lowest asking price was October 2023: for a property for sale, the average price asked was € 935 per square meter.
In December 2024 the average price asked for residential rental properties was € 2.69 per month per square meter, with an increase of 0.00% compared to January 2024 (€ 2.69 monthly per square meter).
Prices per square meter of the municipalities in the province of Cádiz
In December 2024, the asking price for properties for sale in San José del Valle was € 1,024 per square meter, compared to the provincial average of € 1,929.
The asking price for rental properties in San José del Valle was € 2.69 monthly per square meter, compared to the provincial average of € 9.89.
| Municipalities | Sale(€/m²) | Rent(€/m²) |
|---|---|---|
| Cádiz | 2,926 | 11.63 |
| Alcalá de los Gazules | 794 | 4.73 |
| Alcalá del Valle | 469 | - |
| Algar | 659 | - |
| Algeciras | 1,177 | 8.02 |
| Algodonales | 793 | - |
| Arcos de la Frontera | 1,029 | 6.2 |
| Barbate | 2,136 | 8.1 |
| Benalup-Casas Viejas | 1,320 | 2.3 |
| Benaocaz | 1,186 | 3.51 |
| Bornos | 614 | - |
| Castellar de la Frontera | 2,302 | 5.28 |
| Chiclana de la Frontera | 1,847 | 8.42 |
| Chipiona | 2,164 | 11.94 |
| Conil de la Frontera | 2,940 | 8.3 |
| El Bosque | 1,178 | 2.99 |
| El Gastor | 1,648 | 2.67 |
| El Puerto de Santa María | 2,172 | 10.69 |
| Espera | 496 | 5.81 |
| Grazalema | 1,305 | - |
| Jerez de la Frontera | 1,381 | 9.35 |
| Jimena de la Frontera | 1,569 | 5.47 |
| La Línea de la Concepción | 1,723 | 9.31 |
| Los Barrios | 1,424 | 6.55 |
| Medina Sidonia | 1,226 | 3.87 |
| Olvera | 697 | - |
| Paterna de Rivera | 728 | 2.83 |
| Prado del Rey | 712 | 5.77 |
| Puerto Real | 1,545 | 8.46 |
| Puerto Serrano | 516 | - |
| Rota | 2,567 | 14.1 |
| San Fernando | 1,665 | 8.72 |
| San José del Valle | 1,024 | 2.69 |
| San Roque | 3,387 | 11.62 |
| Sanlúcar de Barrameda | 2,008 | 8.34 |
| Setenil de las Bodegas | 1,168 | - |
| Tarifa | 4,409 | 7.97 |
| Torre Alháquime | 544 | - |
| Trebujena | 666 | - |
| Ubrique | 1,047 | 5.23 |
| Vejer de la Frontera | 2,007 | 6.95 |
| Villaluenga del Rosario | 984 | - |
| Villamartín | 1,523 | 5.17 |
| Zahara de la Sierra | 1,181 | - |

The following charts show information about the real estate property of the municipality of San José del Valle and a summary of the demographic and socio-economic aspects that characterize its resident population, consisting of 4,433 inhabitants.
224/Km2
Common surface
20 population/Km2
Population density (2020)