Housing prices in the municipality of Sanlúcar de Barrameda
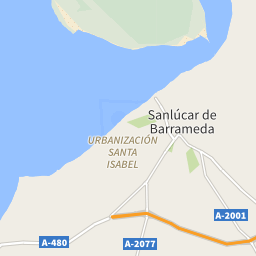
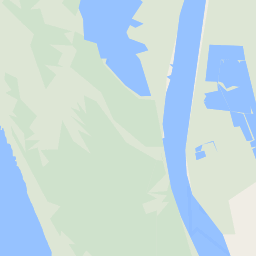
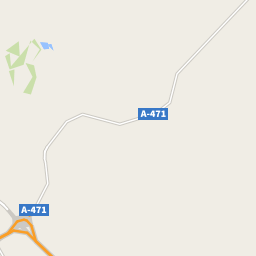
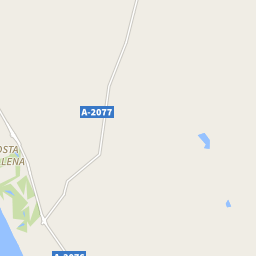
The map shows the average prices of the residential properties in the municipality of Sanlúcar de Barrameda. The reference period is March 2025.
sale
2,000 €/m²
from 1,434 €/m² to 2,472 €/m²
rent
9.17 €/m²
from 4.30 €/m² to 8.50 €/m²
Or rely on the experience of a real estate agency
Search agencyProperty prices trend in Sanlúcar de Barrameda
The following charts show price trends over time for all types of residential property in Sanlúcar de Barrameda, both for sale and for rent.
In March 2025 the average price asked for residential properties for sale was € 2,000 per square meter, with an increase of 6.27% compared to March 2024 (1,882 €/m²). Over the past 2 years, the average price in Sanlúcar de Barrameda municipality reached its peak in December 2024, with a value of € 2,008 per square meter. The month with the lowest asking price was May 2023: for a property for sale, the average price asked was € 1,694 per square meter.
In March 2025 the average price asked for residential rental properties was € 9.17 per month per square meter, with an increase of 17.41% compared to March 2024 (€ 7.81 monthly per square meter). Over the past 2 years, the average price in Sanlúcar de Barrameda municipality reached its peak in July 2024, with a value of € 9.59 per square meter. The month with the lowest asking price was June 2023: for a rental property, the average price asked was € 7.12 per month per square meter.
Prices per square meter of the zones in Sanlúcar de Barrameda
During March 2025, the asking price for properties for sale in Sanlúcar de Barrameda was highest in the Las Piletas area, with € 2,472 per square meter. The lowest price, instead, was in the Barrio Alto area, with an average of € 1,434 per square meter.
During the same month, the asking price for rental properties in Sanlúcar de Barrameda was highest in the Centro-Calzada area, with € 8.50 per month per square meter. The lowest price, instead, was in the Las Palmeras-Dehesilla area, with an average of € 4.30 per month per square meter.
| Zones | Sale(€/m²) | Rent(€/m²) |
|---|---|---|
| El Pino-Bajo de Guía | 1,866 | 5.52 |
| Las Palmeras-Dehesilla | 1,543 | 4.3 |
| Barrio Alto | 1,434 | 8.45 |
| Las Piletas | 2,472 | 8.09 |
| Centro-Calzada | 2,256 | 8.5 |
| La Jara | 2,442 | 6.93 |
| Bonanza-Martín Miguel-Monteolivete | 1,698 | 6.95 |


The following charts show information about the real estate property of the municipality of Sanlúcar de Barrameda and a summary of the demographic and socio-economic aspects that characterize its resident population, consisting of 69,205 inhabitants.
171/Km2
Common surface
405 population/Km2
Population density (2020)