Housing prices in the municipality of Tocina

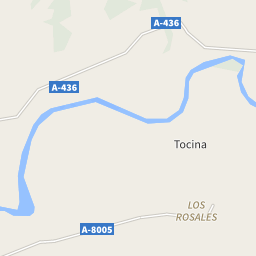
The map shows the average prices of the residential properties in the municipality of Tocina. The reference period is March 2025.

sale

567 €/m²

from 312 €/m² to 2,315 €/m²

rent

0.00 €/m²

from 2.33 €/m² to 12.37 €/m²

Or rely on the experience of a real estate agency

Search agency

Property prices trend in Tocina

The following charts show price trends over time for all types of residential property in Tocina, both for sale and for rent.

Average price sale (€/m²)
495 €
550 €
605 €
660 €
715 €
770 €
825 €
2017
2018
2019
2020
2021
2022
2023
2024
2025

In March 2025 the average price asked for residential properties for sale was € 567 per square meter, with a decrease of 10.85% compared to March 2024 (636 €/m²). Over the past 2 years, the average price in Tocina municipality reached its peak in June 2024, with a value of € 646 per square meter. The month with the lowest asking price was November 2024: for a property for sale, the average price asked was € 540 per square meter.

Average price rent (€/m²)
The service is temporarily unavailable

Currently, we do not have enough information on the prices per square meter asked for rental properties in the municipality of Tocina; we therefore encourage you to return to this page periodically.

Prices per square meter of the municipalities in the province of Sevilla

In March 2025, the asking price for properties for sale in Tocina was € 567 per square meter, compared to the provincial average of € 1,534.

MunicipalitiesSale(€/m²)Rent(€/m²)
Sevilla2,31512.37
Aguadulce4206.22
Alanís868-
Albaida del Aljarafe9223.88
Alcalá de Guadaíra1,2787.48
Alcalá del Río8825.41
Alcolea del Río548-
Algámitas316-
Almadén de La Plata685-
Almensilla1,2815.24
Arahal9632.86
Aznalcázar1,0055.74
Aznalcóllar5563.45
Badolatosa320-
Benacazón1,0063.45
Bollullos de la Mitación1,3526.55
Bormujos1,82810.41
Brenes7743.55
Burguillos7183.6
Camas1,37510.71
Cañada Rosal630-
Cantillana8213.84
Carmona1,1064.11
Carrión de los Céspedes7142.33
Casariche4984.79
Castilblanco de los Arroyos9494.01
Castilleja de Guzmán1,2154.47
Castilleja de la Cuesta1,3859
Castilleja del Campo6882.66
Cazalla de La Sierra822-
Constantina344-
Coria del Río1,0976.4
Coripe513-
Dos Hermanas1,5489.09
Écija1,0345.01
El Castillo de Las Guardas783-
El Coronil534-
El Cuervo de Sevilla771-
El Garrobo9632.79
El Madroño443-
El Pedroso780-
El Real de La Jara722-
El Ronquillo1,065-
El Rubio478-
El Saucejo390-
El Viso del Alcor1,5505.97
Espartinas1,5757.9
Estepa674-
Fuentes de Andalucía4882.5
Gelves1,5318.68
Gerena9524.2
Gilena517-
Gines1,6706.13
Guadalcanal429-
Guillena1,0485.92
Herrera605-
Huévar del Aljarafe1,0803.73
Isla Mayor345-
La Algaba1,1206.7
La Campana882-
La Luisiana602-
La Puebla de Cazalla7382.81
La Puebla de los Infantes3313.29
La Puebla del Río9364.88
La Rinconada1,3596.78
La Roda de Andalucía748-
Lantejuela565-
Las Cabezas de San Juan7012.8
Las Navas de La Concepción640-
Lebrija7665.12
Lora de Estepa611-
Lora del Río701-
Los Corrales446-
Los Molares7872.71
Los Palacios y Villafranca9445.68
Mairena del Alcor1,4536.75
Mairena del Aljarafe1,7019.42
Marchena7194.43
Marinaleda481-
Martín de La Jara312-
Montellano3852.52
Morón de La Frontera8015.2
Olivares1,0067.65
Osuna7494.5
Palomares del Río1,6434.71
Paradas788-
Pedrera758-
Peñaflor404-
Pilas8515.3
Pruna675-
Salteras1,0696.37
San Juan de Aznalfarache1,08110.04
San Nicolás del Puerto721-
Sanlúcar la Mayor1,0528.71
Santiponce1,1758.99
Tocina567-
Tomares1,77410.21
Umbrete1,3855.45
Utrera1,1897.86
Valencina de la Concepción1,2098.73
Villamanrique de la Condesa7332.7
Villanueva de San Juan353-
Villanueva del Ariscal1,1343.46
Villanueva del Río y Minas479-
Villaverde del Río9043.01
Real estate agencies in the municipality of Tocina
Socio-demographic data in the municipality of Tocina

The following charts show information about the real estate property of the municipality of Tocina and a summary of the demographic and socio-economic aspects that characterize its resident population, consisting of 9,486 inhabitants.

Total Dwellings: 4,716 (2020)
0
0 K
0 K
0 K
0 K
1 K
1 K
1 K
1 K
1 K
1 K
47
-1920
-1920
283
'21-'50
'21-'50
472
'51-'60
'51-'60
707
'61-'70
'61-'70
755
'71-'80
'71-'80
802
'81-'90
'81-'90
660
'91-'01
'91-'01
990
2002-
2002-
Population: 9,486 (2020)
9,450
9,500
9,550
9,600
9,650
9,700
9,750
9,800
2015
2017
2019
Common surface

15/Km2

Common surface

Population density

613 population/Km2

Population density (2020)
Percentage of population by age group. Average age: 41.74 years (2020)
0 %
5 %
10 %
15 %
20 %
25 %
30 %
35 %
40 %
9 %
<10
<10
10 %
10-19
10-19
17 %
20-34
20-34
39 %
35-59
35-59
15 %
60-74
60-74
8 %
75+
75+
Average annual income: 15,646 (€/year 2018)
14,250 €
14,400 €
14,550 €
14,700 €
14,850 €
15,000 €
15,150 €
15,300 €
15,450 €
15,600 €
15,750 €
15,900 €
2015
2017
© OpenStreetMap contributors
< 400 €/m²> 1,300 €/m²