Housing prices in the municipality of La Aldea de San Nicolás
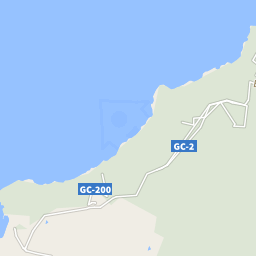
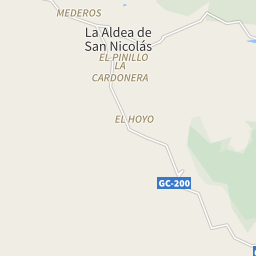
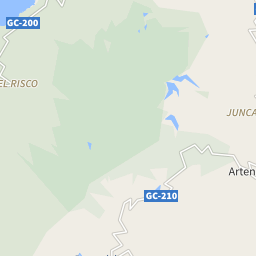
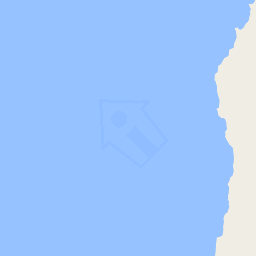
The map shows the average prices of the residential properties in the municipality of La Aldea de San Nicolás. The reference period is December 2024.
sale
1,039 €/m²
from 1,039 €/m² to 3,938 €/m²
rent
8.56 €/m²
from 2.94 €/m² to 21.23 €/m²
Or rely on the experience of a real estate agency
Search agencyProperty prices trend in La Aldea de San Nicolás
The following charts show price trends over time for all types of residential property in La Aldea de San Nicolás, both for sale and for rent.
In December 2024 the average price asked for residential properties for sale was € 1,039 per square meter, with an increase of 11.48% compared to January 2024 (932 €/m²). Over the past 2 years, the average price in La Aldea de San Nicolás municipality reached its peak in December 2024, with a value of € 1,039 per square meter. The month with the lowest asking price was July 2023: for a property for sale, the average price asked was € 825 per square meter.
In December 2024 the average price asked for residential rental properties was € 8.56 per month per square meter, with an increase of 0.00% compared to January 2024 (€ 8.56 monthly per square meter).
Prices per square meter of the municipalities in the province of Las Palmas
In December 2024, the asking price for properties for sale in La Aldea de San Nicolás was € 1,039 per square meter, compared to the provincial average of € 2,478.
The asking price for rental properties in La Aldea de San Nicolás was € 8.56 monthly per square meter, compared to the provincial average of € 16.65.
| Municipalities | Sale(€/m²) | Rent(€/m²) |
|---|---|---|
| Las Palmas de Gran Canaria | 2,457 | 13.38 |
| Agaete | 1,718 | 8.47 |
| Agüimes | 1,536 | 11.39 |
| Antigua | 2,350 | 9.03 |
| Arrecife | 1,918 | 14.23 |
| Artenara | 1,073 | - |
| Arucas | 1,321 | 8.67 |
| Betancuria | 1,227 | - |
| Firgas | 1,286 | 2.94 |
| Gáldar | 1,328 | 5.4 |
| Haría | 1,923 | 4.83 |
| Ingenio | 1,246 | 6.66 |
| La Aldea de San Nicolás | 1,039 | 8.56 |
| La Oliva | 3,090 | 16.93 |
| Mogán | 3,812 | 19.7 |
| Moya (Las Palmas) | 1,174 | 9.16 |
| Pájara | 2,514 | 7.8 |
| Puerto del Rosario | 1,724 | 11.38 |
| San Bartolomé | 2,635 | 12.73 |
| San Bartolomé de Tirajana | 3,938 | 21.23 |
| Santa Brígida | 1,785 | 9.34 |
| Santa Lucía de Tirajana | 1,413 | 11.29 |
| Santa María de Guía de Gran Canaria | 1,242 | 4.53 |
| Teguise | 2,919 | 15.12 |
| Tejeda | 1,203 | - |
| Telde | 1,469 | 10.55 |
| Teror | 1,206 | 8.75 |
| Tías | 3,475 | 11.45 |
| Tinajo | 1,934 | 8.23 |
| Tuineje | 2,006 | 5.88 |
| Valleseco | 1,104 | 6.3 |
| Valsequillo de Gran Canaria | 1,200 | 8.24 |
| Vega de San Mateo | 1,437 | 4.66 |
| Yaiza | 3,647 | 9.22 |


The following charts show information about the real estate property of the municipality of La Aldea de San Nicolás and a summary of the demographic and socio-economic aspects that characterize its resident population, consisting of 7,508 inhabitants.
129/Km2
Common surface
58 population/Km2
Population density (2020)