Housing prices in the municipality of Mogán
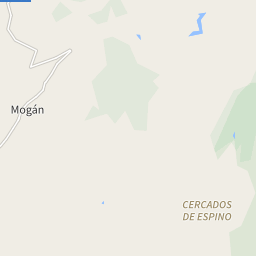
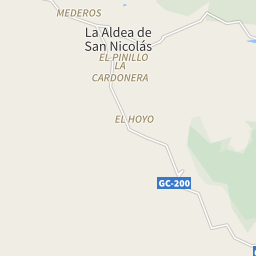
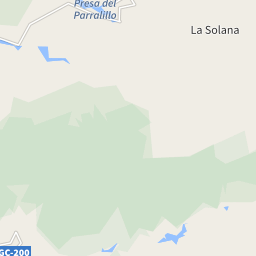
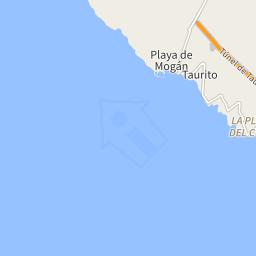
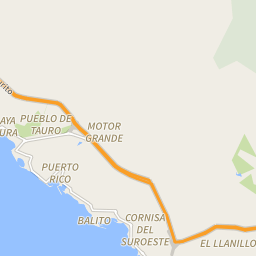
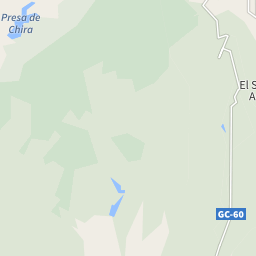
The map shows the average prices of the residential properties in the municipality of Mogán. The reference period is March 2025.
sale
3,987 €/m²
from 2,769 €/m² to 4,476 €/m²
rent
20.82 €/m²
from 6.46 €/m² to 21.28 €/m²
Or rely on the experience of a real estate agency
Search agencyProperty prices trend in Mogán
The following charts show price trends over time for all types of residential property in Mogán, both for sale and for rent.
In March 2025 the average price asked for residential properties for sale was € 3,987 per square meter, with an increase of 16.99% compared to March 2024 (3,408 €/m²). Over the past 2 years, the average price in Mogán municipality reached its peak in March 2025, with a value of € 3,987 per square meter. The month with the lowest asking price was July 2023: for a property for sale, the average price asked was € 3,295 per square meter.
In March 2025 the average price asked for residential rental properties was € 20.82 per month per square meter, with an increase of 15.92% compared to March 2024 (€ 17.96 monthly per square meter). Over the past 2 years, the average price in Mogán municipality reached its peak in March 2025, with a value of € 20.82 per square meter. The month with the lowest asking price was May 2023: for a rental property, the average price asked was € 16.61 per month per square meter.
Prices per square meter of the zones in Mogán
During March 2025, the asking price for properties for sale in Mogán was highest in the Taurito-Puerto de Mogán area, with € 4,476 per square meter. The lowest price, instead, was in the Área de Mogán area, with an average of € 2,769 per square meter.
During the same month, the asking price for rental properties in Mogán was highest in the Patalavaca-Arguineguín area, with € 21.28 per month per square meter. The lowest price, instead, was in the Los Almácigos-El Horno area, with an average of € 6.46 per month per square meter.
| Zones | Sale(€/m²) | Rent(€/m²) |
|---|---|---|
| Taurito-Puerto de Mogán | 4,476 | 20.67 |
| Puerto Rico | 4,120 | 21.03 |
| Los Caideros | 3,929 | 18.05 |
| Los Almácigos-El Horno | 3,279 | 6.46 |
| Patalavaca-Arguineguín | 4,084 | 21.28 |
| Anfi Tauro Golf-Pueblo de Tauro | 4,078 | 20.52 |
| Área de Mogán | 2,769 | 11.84 |


The following charts show information about the real estate property of the municipality of Mogán and a summary of the demographic and socio-economic aspects that characterize its resident population, consisting of 20,487 inhabitants.
179/Km2
Common surface
114 population/Km2
Population density (2020)