Housing prices in the municipality of San Bartolomé de Tirajana
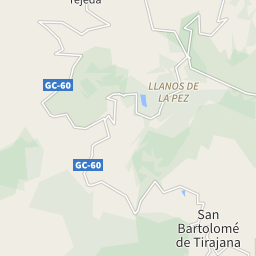
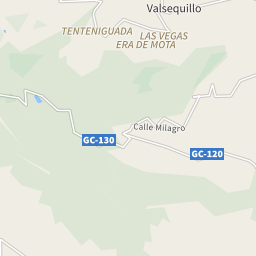
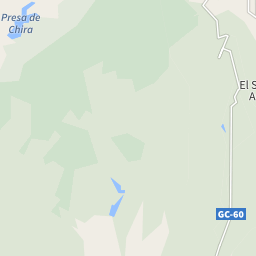
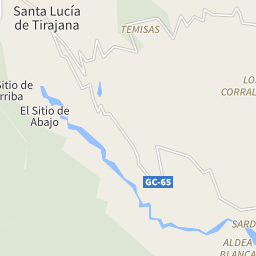
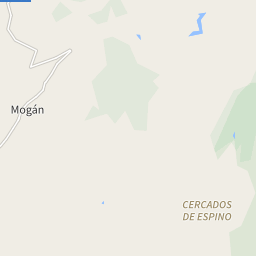
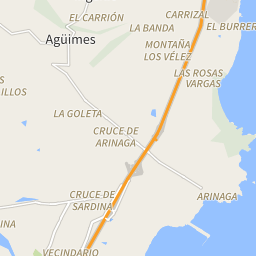
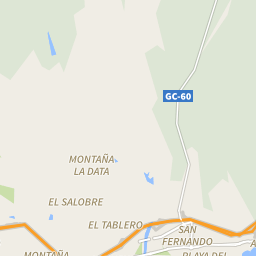
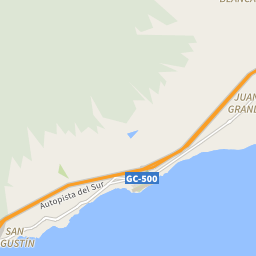
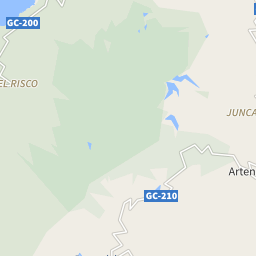
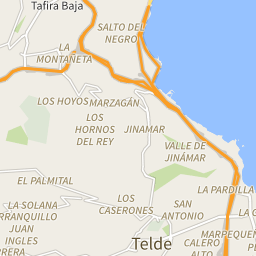
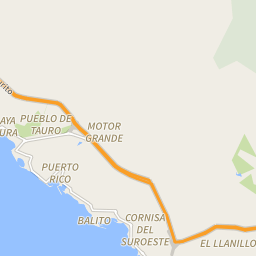
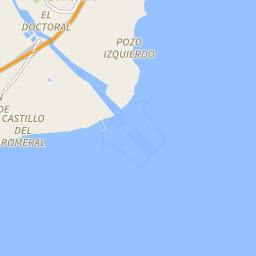
The map shows the average prices of the residential properties in the municipality of San Bartolomé de Tirajana. The reference period is December 2024.
sale
3,938 €/m²
from 2,314 €/m² to 4,982 €/m²
rent
21.23 €/m²
from 13.19 €/m² to 22.92 €/m²
Or rely on the experience of a real estate agency
Search agencyProperty prices trend in San Bartolomé de Tirajana
The following charts show price trends over time for all types of residential property in San Bartolomé de Tirajana, both for sale and for rent.
In December 2024 the average price asked for residential properties for sale was € 3,938 per square meter, with an increase of 12.61% compared to January 2024 (3,497 €/m²). Over the past 2 years, the average price in San Bartolomé de Tirajana municipality reached its peak in December 2024, with a value of € 3,938 per square meter. The month with the lowest asking price was March 2023: for a property for sale, the average price asked was € 3,266 per square meter.
In December 2024 the average price asked for residential rental properties was € 21.23 per month per square meter, with an increase of 8.54% compared to January 2024 (€ 19.56 monthly per square meter). Over the past 2 years, the average price in San Bartolomé de Tirajana municipality reached its peak in September 2024, with a value of € 21.28 per square meter. The month with the lowest asking price was April 2023: for a rental property, the average price asked was € 17.93 per month per square meter.
Prices per square meter of the zones in San Bartolomé de Tirajana
During December 2024, the asking price for properties for sale in San Bartolomé de Tirajana was highest in the El Salobre area, with € 4,982 per square meter. The lowest price, instead, was in the Zona Interior area, with an average of € 2,314 per square meter.
During the same month, the asking price for rental properties in San Bartolomé de Tirajana was highest in the Maspalomas-Meloneras area, with € 22.92 per month per square meter. The lowest price, instead, was in the El Tablero de Maspalomas area, with an average of € 13.19 per month per square meter.
| Zones | Sale(€/m²) | Rent(€/m²) |
|---|---|---|
| Playa del Inglés | 4,324 | 22.52 |
| Sonnenland | 3,748 | 19.68 |
| Zona Interior | 2,314 | 18.66 |
| Montaña La Data | 3,409 | 15.42 |
| San Agustín-Bahía Feliz | 4,017 | 20.87 |
| El Salobre | 4,982 | 15.18 |
| El Tablero de Maspalomas | 2,343 | 13.19 |
| San Fernando | 2,631 | 16.12 |
| Maspalomas-Meloneras | 4,747 | 22.92 |


The following charts show information about the real estate property of the municipality of San Bartolomé de Tirajana and a summary of the demographic and socio-economic aspects that characterize its resident population, consisting of 53,397 inhabitants.
346/Km2
Common surface
155 population/Km2
Population density (2020)