Housing prices in the municipality of Teguise
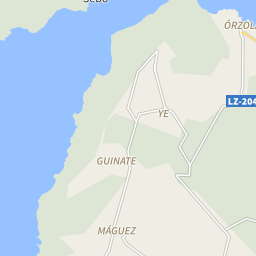
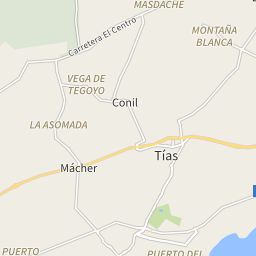
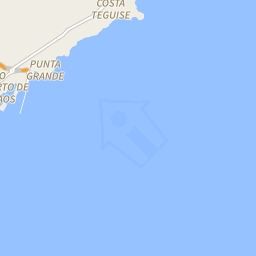
The map shows the average prices of the residential properties in the municipality of Teguise. The reference period is March 2025.
sale
2,934 €/m²
from 2,186 €/m² to 3,823 €/m²
rent
15.42 €/m²
from 6.40 €/m² to 9.46 €/m²
Or rely on the experience of a real estate agency
Search agencyProperty prices trend in Teguise
The following charts show price trends over time for all types of residential property in Teguise, both for sale and for rent.
In March 2025 the average price asked for residential properties for sale was € 2,934 per square meter, with an increase of 25.71% compared to March 2024 (2,334 €/m²). Over the past 2 years, the average price in Teguise municipality reached its peak in March 2025, with a value of € 2,934 per square meter. The month with the lowest asking price was September 2023: for a property for sale, the average price asked was € 2,062 per square meter.
In March 2025 the average price asked for residential rental properties was € 15.42 per month per square meter, with an increase of 64.39% compared to March 2024 (€ 9.38 monthly per square meter). Over the past 2 years, the average price in Teguise municipality reached its peak in March 2025, with a value of € 15.42 per square meter. The month with the lowest asking price was January 2024: for a rental property, the average price asked was € 8.60 per month per square meter.
Prices per square meter of the zones in Teguise
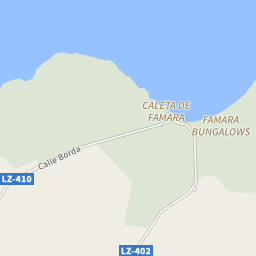
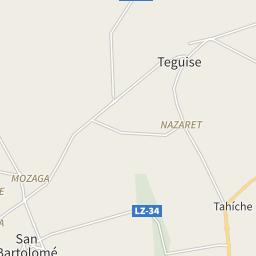
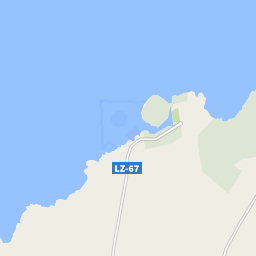
During March 2025, the asking price for properties for sale in Teguise was highest in the Famara-La Graciosa area, with € 3,823 per square meter. The lowest price, instead, was in the Nazaret-Teseguite area, with an average of € 2,186 per square meter.
During the same month, the asking price for rental properties in Teguise was highest in the Costa Teguise area, with € 9.46 per month per square meter. The lowest price, instead, was in the Villa de Teguise area, with an average of € 6.40 per month per square meter.
| Zones | Sale(€/m²) | Rent(€/m²) |
|---|---|---|
| Costa Teguise | 3,250 | 9.46 |
| Tahiche | 2,279 | 7.79 |
| Nazaret-Teseguite | 2,186 | - |
| Villa de Teguise | 2,402 | 6.4 |
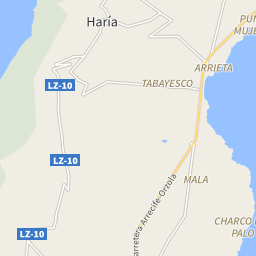
| Guatisa-Los Valles-El Mojón | 2,817 | - |
| Área Soo-Tao | 2,870 | - |
| Famara-La Graciosa | 3,823 | 7.67 |


The following charts show information about the real estate property of the municipality of Teguise and a summary of the demographic and socio-economic aspects that characterize its resident population, consisting of 22,703 inhabitants.
257/Km2
Common surface
88 population/Km2
Population density (2020)