Housing prices in the municipality of Talavera de la Reina
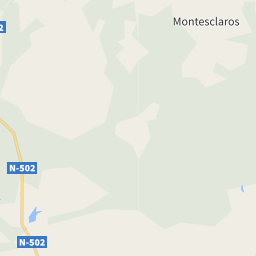
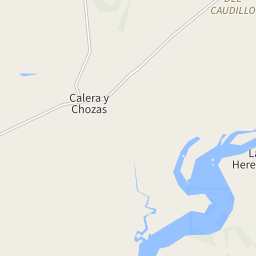
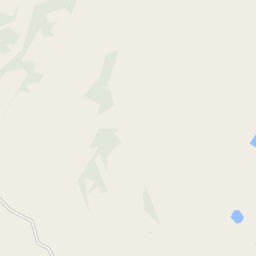
The map shows the average prices of the residential properties in the municipality of Talavera de la Reina. The reference period is December 2024.
sale
868 €/m²
from 599 €/m² to 1,046 €/m²
rent
7.04 €/m²
from 4.04 €/m² to 7.54 €/m²
Or rely on the experience of a real estate agency
Search agencyProperty prices trend in Talavera de la Reina
The following charts show price trends over time for all types of residential property in Talavera de la Reina, both for sale and for rent.
In December 2024 the average price asked for residential properties for sale was € 868 per square meter, with an increase of 10.01% compared to January 2024 (789 €/m²). Over the past 2 years, the average price in Talavera de la Reina municipality reached its peak in December 2024, with a value of € 868 per square meter. The month with the lowest asking price was May 2023: for a property for sale, the average price asked was € 758 per square meter.
In December 2024 the average price asked for residential rental properties was € 7.04 per month per square meter, with an increase of 10.87% compared to January 2024 (€ 6.35 monthly per square meter). Over the past 2 years, the average price in Talavera de la Reina municipality reached its peak in July 2024, with a value of € 7.25 per square meter. The month with the lowest asking price was April 2023: for a rental property, the average price asked was € 5.63 per month per square meter.
Prices per square meter of the zones in Talavera de la Reina
During December 2024, the asking price for properties for sale in Talavera de la Reina was highest in the Puerta de Cuartos-Avenida de Portugal area, with € 1,046 per square meter. The lowest price, instead, was in the Ribera del Tajo area, with an average of € 599 per square meter.
During the same month, the asking price for rental properties in Talavera de la Reina was highest in the Centro area, with € 7.54 per month per square meter. The lowest price, instead, was in the Patrocinio de San José-Talavera la Nueva-Gamonal area, with an average of € 4.04 per month per square meter.
| Zones | Sale(€/m²) | Rent(€/m²) |
|---|---|---|
| El Pilar-La Estación | 853 | 6.9 |
| Centro | 882 | 7.54 |
| Puerta de Cuartos-Avenida de Portugal | 1,046 | 6.69 |
| Hospital-Nuevo Centro | 990 | 7.17 |
| Tres Olivos-La Piedad | 881 | 7.03 |
| Patrocinio de San José-Talavera la Nueva-Gamonal | 670 | 4.04 |
| Ribera del Tajo | 599 | 4.43 |


The following charts show information about the real estate property of the municipality of Talavera de la Reina and a summary of the demographic and socio-economic aspects that characterize its resident population, consisting of 83,663 inhabitants.
186/Km2
Common surface
450 population/Km2
Population density (2020)