Housing prices in the municipality of Albinyana

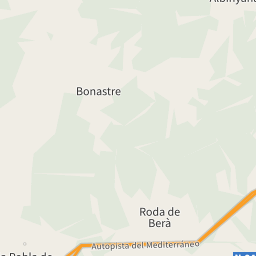
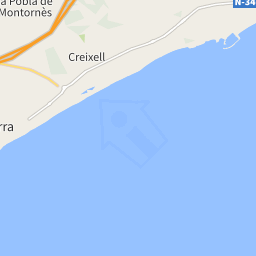
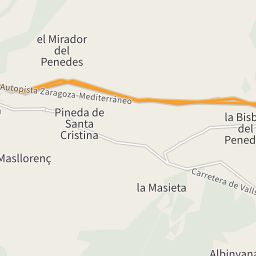
The map shows the average prices of the residential properties in the municipality of Albinyana. The reference period is March 2025.

sale

1,334 €/m²

from 164 €/m² to 2,341 €/m²

rent

4.84 €/m²

from 1.52 €/m² to 10.86 €/m²

Or rely on the experience of a real estate agency

Search agency

Property prices trend in Albinyana

The following charts show price trends over time for all types of residential property in Albinyana, both for sale and for rent.

Average price sale (€/m²)
990 €
1,045 €
1,100 €
1,155 €
1,210 €
1,265 €
1,320 €
1,375 €
1,430 €
2017
2018
2019
2020
2021
2022
2023
2024
2025

In March 2025 the average price asked for residential properties for sale was € 1,334 per square meter, with a decrease of 2.70% compared to March 2024 (1,371 €/m²). Over the past 2 years, the average price in Albinyana municipality reached its peak in December 2024, with a value of € 1,379 per square meter. The month with the lowest asking price was May 2023: for a property for sale, the average price asked was € 1,217 per square meter.

Average price rent (€/m²)
4 €
5 €
6 €
7 €
2017
2018
2019
2020
2021
2022
2023
2024
2025

In March 2025 the average price asked for residential rental properties was € 4.84 per month per square meter, with an increase of 0.00% compared to March 2024 (€ 4.84 monthly per square meter). Over the past 2 years, the average price in Albinyana municipality reached its peak in June 2023, with a value of € 4.85 per square meter.

Prices per square meter of the municipalities in the province of Tarragona

In March 2025, the asking price for properties for sale in Albinyana was € 1,334 per square meter, compared to the provincial average of € 1,603.
The asking price for rental properties in Albinyana was € 4.84 monthly per square meter, compared to the provincial average of € 9.11.

MunicipalitiesSale(€/m²)Rent(€/m²)
Tarragona1,69810.86
Aiguamúrcia6443.64
Albinyana1,3344.84
Alcanar1,6466.82
Alcover1,0964.44
Aldover724-
Alfara de Carles6232.37
Alforja9265.07
Alió994-
Almoster1,1854.39
Altafulla2,3419.97
Amposta1,0826.89
Arbolí873-
Arnes733-
Ascó283-
Banyeres del Penedès1,2656.84
Barberà de la Conca671-
Batea462-
Bellmunt del Priorat275-
Bellvei1,2276.17
Benifallet5403
Benissanet350-
Blancafort414-
Bonastre8463.75
Bot649-
Botarell1,142-
Bràfim5242.98
Cabacés--
Cabra del Camp9034.3
Calafell2,08210.13
Camarles1,0834.73
Cambrils2,30310.75
Capafonts453-
Capçanes486-
Caseres615-
Castellvell del Camp1,2375.14
Colldejou534-
Conesa363-
Constantí9066.45
Corbera d'Ebre226-
Cornudella de Montsant1,882-
Creixell1,8367.85
Cunit1,9739.82
Deltebre1,0274.75
Duesaigües523-
El Catllar1,3624.3
El Lloar--
El Masroig2507.17
El Milà853-
El Molar (Tarragona)303-
El Montmell9013.87
El Morell1,0638.34
El Perelló1,3235.78
El Pinell de Brai329-
El Pla de Santa Maria7763.72
El Pont d'Armentera520-
El Rourell860-
El Vendrell1,6389.01
Els Garidells1,303-
Els Guiamets495-
Els Pallaresos1,1106.55
Falset745-
Figuerola del Camp728-
Flix8033.1
Forès359-
Freginals500-
Gandesa9222.99
Garcia4394.52
Ginestar362-
Godall232-
Gratallops800-
Horta de Sant Joan8174.31
L'Albiol793-
L'Aldea8576.2
L'Aleixar673-
L'Ametlla de Mar1,9396.44
L'Ampolla1,8547.78
L'Arboç1,2217.77
L'Argentera387-
L'Espluga de Francolí5394.24
La Bisbal de Falset214-
La Bisbal del Penedès1,1216.44
La Canonja1,1448.41
La Fatarella211-
La Febró--
La Figuera303-
La Galera5393.73
La Masó289-
La Morera de Montsant704-
La Nou de Gaià1,269-
La Palma d'Ebre1,195-
La Pobla de Mafumet1,3069.83
La Pobla de Massaluca212-
La Pobla de Montornès1,4436.59
La Riba6635.22
La Riera de Gaià1,0504.57
La Secuita1,1916.15
La Selva del Camp9175.54
La Sénia6085.37
La Torre de Fontaubella--
La Torre de l'Espanyol364-
La Vilella Alta--
La Vilella Baixa385-
Les Borges del Camp1,1233.92
Les Piles1,483-
Llorac170-
Llorenç del Penedès1,2463.94
Marçà806-
Margalef164-
Mas de Barberans732-
Masdenverge8053.16
Masllorenç719-
Maspujols1,2853.84
Miravet577-
Mont-ral550-
Mont-roig del Camp1,8478.26
Montblanc1,5535.71
Montbrió del Camp1,3946.9
Montferri1,0742.32
Móra d'Ebre6794.23
Móra la Nova5353.75
Nulles7053.86
Passanant i Belltall688-
Paüls3931.52
Perafort1,0533.75
Pira476-
Poboleda499-
Pontils778-
Porrera1,326-
Pradell de la Teixeta3727
Prades1,0894.74
Prat de Comte--
Pratdip1,300-
Puigpelat9224.82
Querol806-
Rasquera452-
Renau596-
Reus1,3548.54
Riba-Roja d'Ebre414-
Riudecanyes1,5575.71
Riudecols5405.7
Riudoms1,1624.39
Rocafort de Queralt200-
Roda de Berà1,7727.8
Rodonyà9013.89
Roquetes1,1615.79
Salomó7423.81
Salou2,33810.46
Sant Carles de la Ràpita1,4227.6
Sant Jaume d'Enveja1,0344.49
Sant Jaume dels Domenys1,2503.45
Santa Bàrbara6682.98
Santa Coloma de Queralt5822.62
Santa Oliva1,2655.78
Sarral7713.78
Savallà del Comtat347-
Senan--
Solivella344-
Tivenys3734.62
Tivissa699-
Torredembarra1,9678.09
Torroja del Priorat--
Tortosa9586.88
Ulldecona5248.54
Ulldemolins581-
Vallclara--
Vallfogona de Riucorb544-
Vallmoll1,0194.53
Valls9606.46
Vandellòs i l'Hospitalet de l'Infant1,7197.56
Vespella de Gaià1,3324.62
Vila-rodona3633.29
Vila-seca1,9779.13
Vilabella357-
Vilalba dels Arcs--
Vilallonga del Camp2,0373.93
Vilanova d'Escornalbou902-
Vilanova de Prades--
Vilaplana731-
Vilaverd502-
Vimbodí i Poblet4623.27
Vinebre229-
Vinyols i els Arcs1,8337.63
Xerta479-
Real estate agencies in the municipality of Albinyana
Socio-demographic data in the municipality of Albinyana

The following charts show information about the real estate property of the municipality of Albinyana and a summary of the demographic and socio-economic aspects that characterize its resident population, consisting of 2,468 inhabitants.

Total Dwellings: 1,771 (2020)
0
0 K
0 K
0 K
0 K
0 K
0 K
0 K
0 K
0 K
1 K
1 K
1 K
1 K
1 K
1 K
195
-1920
-1920
35
'21-'50
'21-'50
35
'51-'60
'51-'60
71
'61-'70
'61-'70
708
'71-'80
'71-'80
301
'81-'90
'81-'90
372
'91-'01
'91-'01
53
2002-
2002-
Population: 2,468 (2020)
2,250
2,300
2,350
2,400
2,450
2,500
2015
2017
2019
Common surface

20/Km2

Common surface

Population density

126 population/Km2

Population density (2020)
Percentage of population by age group. Average age: 42.66 years (2020)
0 %
5 %
10 %
15 %
20 %
25 %
30 %
35 %
40 %
10 %
<10
<10
10 %
10-19
10-19
14 %
20-34
20-34
39 %
35-59
35-59
16 %
60-74
60-74
8 %
75+
75+
Average annual income: 19,884 (€/year 2018)
18,000 €
18,500 €
19,000 €
19,500 €
20,000 €
20,500 €
2015
2017
© OpenStreetMap contributors
< 300 €/m²> 2,100 €/m²