Housing prices in the municipality of Calafell
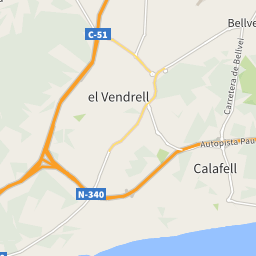
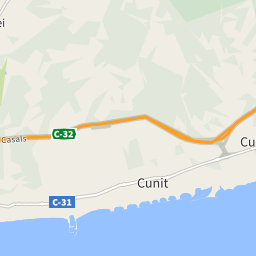
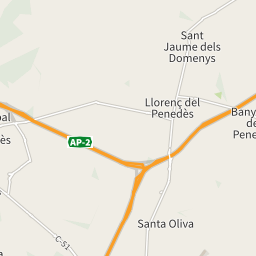
The map shows the average prices of the residential properties in the municipality of Calafell. The reference period is December 2024.
sale
2,048 €/m²
from 1,120 €/m² to 2,606 €/m²
rent
10.50 €/m²
from 4.69 €/m² to 11.46 €/m²
Or rely on the experience of a real estate agency
Search agencyProperty prices trend in Calafell
The following charts show price trends over time for all types of residential property in Calafell, both for sale and for rent.
In December 2024 the average price asked for residential properties for sale was € 2,048 per square meter, with an increase of 8.76% compared to January 2024 (1,883 €/m²). Over the past 2 years, the average price in Calafell municipality reached its peak in November 2024, with a value of € 2,057 per square meter. The month with the lowest asking price was August 2023: for a property for sale, the average price asked was € 1,843 per square meter.
In December 2024 the average price asked for residential rental properties was € 10.50 per month per square meter, with an increase of 6.71% compared to January 2024 (€ 9.84 monthly per square meter). Over the past 2 years, the average price in Calafell municipality reached its peak in July 2024, with a value of € 11.65 per square meter. The month with the lowest asking price was March 2023: for a rental property, the average price asked was € 8.89 per month per square meter.
Prices per square meter of the zones in Calafell
During December 2024, the asking price for properties for sale in Calafell was highest in the Platja de Calafell area, with € 2,606 per square meter. The lowest price, instead, was in the Segur de Dalt-Les Brises area, with an average of € 1,120 per square meter.
During the same month, the asking price for rental properties in Calafell was highest in the Platja de Segur de Calafell area, with € 11.46 per month per square meter. The lowest price, instead, was in the Segur de Dalt-Les Brises area, with an average of € 4.69 per month per square meter.
| Zones | Sale(€/m²) | Rent(€/m²) |
|---|---|---|
| Valldemar-Calafell Parc-Mas Romeu | 1,415 | 8.72 |
| Segur de Dalt-Les Brises | 1,120 | 4.69 |
| Bellamar-Mas de la Mel | 2,194 | 10.23 |
| Platja de Calafell | 2,606 | 11 |
| Platja de Segur de Calafell | 2,290 | 11.46 |
| Calafell Poble | 1,891 | 7.82 |
| Segur de Calafell | 1,740 | 10.03 |
| Bonanova | 1,952 | 4.82 |
The following charts show information about the real estate property of the municipality of Calafell and a summary of the demographic and socio-economic aspects that characterize its resident population, consisting of 27,601 inhabitants.
20/Km2
Common surface
1,352 population/Km2
Population density (2020)