Housing prices in the municipality of Manresa
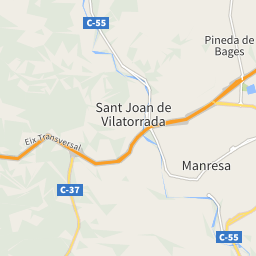
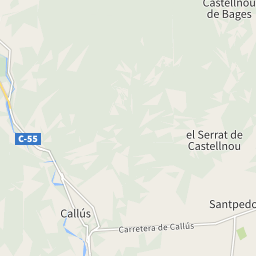
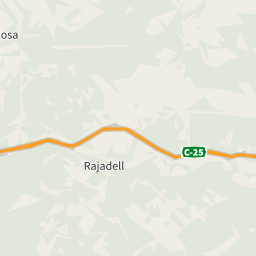
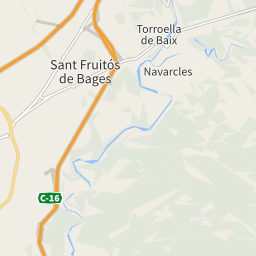
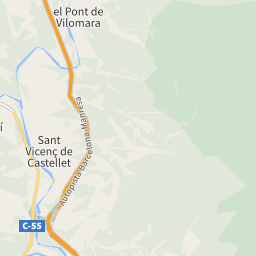
The map shows the average prices of the residential properties in the municipality of Manresa. The reference period is March 2025.
sale
1,419 €/m²
from 989 €/m² to 1,777 €/m²
rent
8.72 €/m²
from 6.58 €/m² to 9.49 €/m²
Or rely on the experience of a real estate agency
Search agencyProperty prices trend in Manresa
The following charts show price trends over time for all types of residential property in Manresa, both for sale and for rent.
In March 2025 the average price asked for residential properties for sale was € 1,419 per square meter, with an increase of 11.73% compared to March 2024 (1,270 €/m²). Over the past 2 years, the average price in Manresa municipality reached its peak in March 2025, with a value of € 1,419 per square meter. The month with the lowest asking price was July 2023: for a property for sale, the average price asked was € 1,197 per square meter.
In March 2025 the average price asked for residential rental properties was € 8.72 per month per square meter, with an increase of 9.00% compared to March 2024 (€ 8.00 monthly per square meter). Over the past 2 years, the average price in Manresa municipality reached its peak in March 2025, with a value of € 8.72 per square meter. The month with the lowest asking price was June 2023: for a rental property, the average price asked was € 7.68 per month per square meter.
Prices per square meter of the zones in Manresa
During March 2025, the asking price for properties for sale in Manresa was highest in the Poblenou-Bases-Carretera de Santpedor area, with € 1,777 per square meter. The lowest price, instead, was in the Congost-Farreres-Santa Catarina area, with an average of € 989 per square meter.
During the same month, the asking price for rental properties in Manresa was highest in the Valldaura-Plaça Catalunya area, with € 9.49 per month per square meter. The lowest price, instead, was in the La Balconada-Cal Gravat area, with an average of € 6.58 per month per square meter.
| Zones | Sale(€/m²) | Rent(€/m²) |
|---|---|---|
| Mion | 1,233 | 8.71 |
| Passeig i Rodalies-Carretera de Vic | 1,499 | 8.38 |
| Sagrada Familia-Font dels Capellans | 1,391 | 8.27 |
| Poblenou-Bases-Carretera de Santpedor | 1,777 | 9.37 |
| Escodines | 1,056 | 7.98 |
| La Balconada-Cal Gravat | 1,181 | 6.58 |
| Congost-Farreres-Santa Catarina | 989 | 8.57 |
| Valldaura-Plaça Catalunya | 1,365 | 9.49 |
| Antic | 1,208 | 7.57 |


The following charts show information about the real estate property of the municipality of Manresa and a summary of the demographic and socio-economic aspects that characterize its resident population, consisting of 78,245 inhabitants.
42/Km2
Common surface
1,875 population/Km2
Population density (2020)