Housing prices in the municipality of Tordera
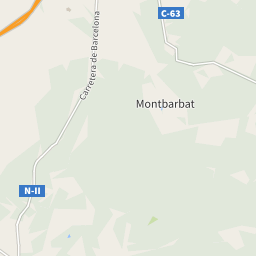
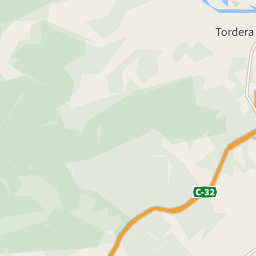
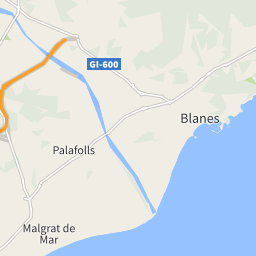
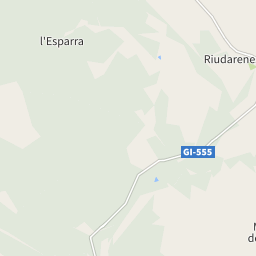
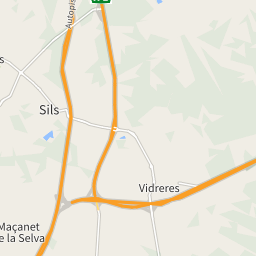
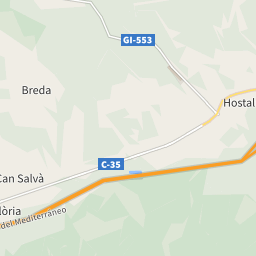
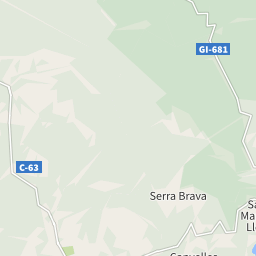
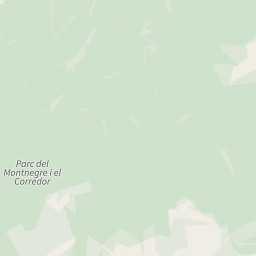
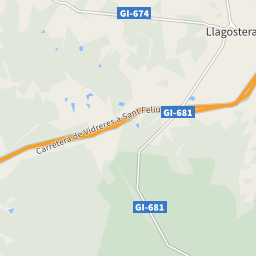
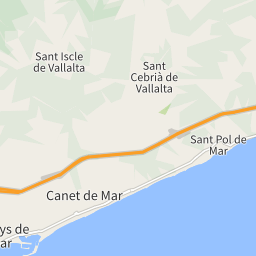
The map shows the average prices of the residential properties in the municipality of Tordera. The reference period is March 2025.
sale
1,572 €/m²
from 1,491 €/m² to 1,661 €/m²
rent
10.50 €/m²
from 4.26 €/m² to 10.34 €/m²
Or rely on the experience of a real estate agency
Search agencyProperty prices trend in Tordera
The following charts show price trends over time for all types of residential property in Tordera, both for sale and for rent.
In March 2025 the average price asked for residential properties for sale was € 1,572 per square meter, with an increase of 10.24% compared to March 2024 (1,426 €/m²). Over the past 2 years, the average price in Tordera municipality reached its peak in March 2025, with a value of € 1,572 per square meter. The month with the lowest asking price was March 2024: for a property for sale, the average price asked was € 1,426 per square meter.
In March 2025 the average price asked for residential rental properties was € 10.50 per month per square meter, with an increase of 0.38% compared to March 2024 (€ 10.46 monthly per square meter). Over the past 2 years, the average price in Tordera municipality reached its peak in December 2024, with a value of € 11.30 per square meter. The month with the lowest asking price was December 2023: for a rental property, the average price asked was € 9.62 per month per square meter.
Prices per square meter of the zones in Tordera
During March 2025, the asking price for properties for sale in Tordera was highest in the Urbanitzacions Terrabrava-Tordera Parc area, with € 1,661 per square meter. The lowest price, instead, was in the Urbanitzacions El Mas Móra-Sant Daniel-Blanes Mar area, with an average of € 1,491 per square meter.
During the same month, the asking price for rental properties in Tordera was highest in the Nucli Urbà area, with € 10.34 per month per square meter. The lowest price, instead, was in the Urbanitzacions Terrabrava-Tordera Parc area, with an average of € 4.26 per month per square meter.
| Zones | Sale(€/m²) | Rent(€/m²) |
|---|---|---|
| Urbanitzacions Terrabrava-Tordera Parc | 1,661 | 4.26 |
| Nucli Urbà | 1,615 | 10.34 |
| Urbanitzacions El Mas Móra-Sant Daniel-Blanes Mar | 1,491 | 6.72 |
| Urbanitzacions Niàgara Parc-Àgora Parc-Roca-Rossa | 1,561 | 5.49 |
| Can Nadal-Sant Pere | 1,525 | 7.13 |


The following charts show information about the real estate property of the municipality of Tordera and a summary of the demographic and socio-economic aspects that characterize its resident population, consisting of 17,519 inhabitants.
86/Km2
Common surface
205 population/Km2
Population density (2020)