Housing prices in the municipality of Bétera
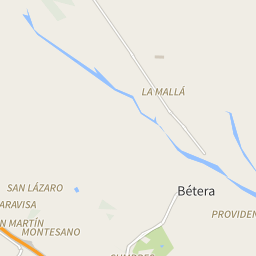
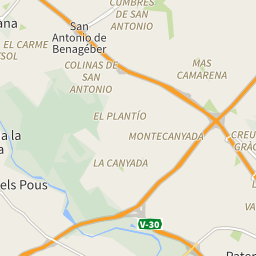
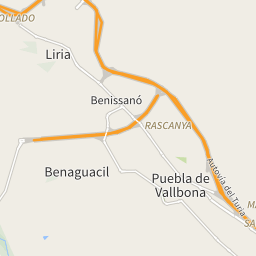
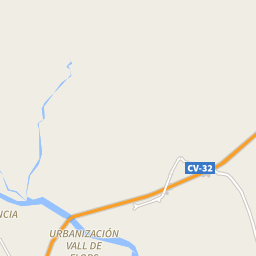
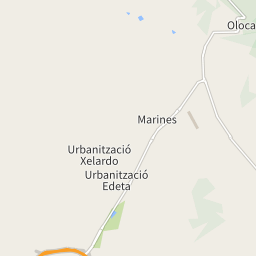
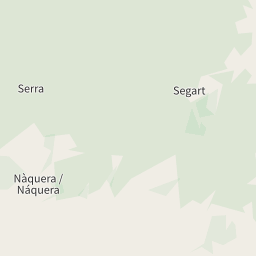
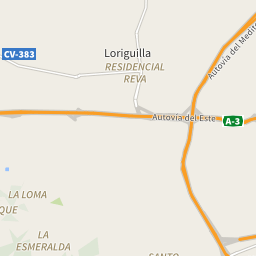
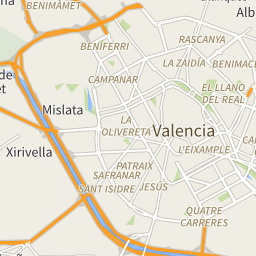
The map shows the average prices of the residential properties in the municipality of Bétera. The reference period is March 2025.
sale
1,832 €/m²
from 1,487 €/m² to 2,132 €/m²
rent
14.31 €/m²
from 4.27 €/m² to 14.76 €/m²
Or rely on the experience of a real estate agency
Search agencyProperty prices trend in Bétera
The following charts show price trends over time for all types of residential property in Bétera, both for sale and for rent.
In March 2025 the average price asked for residential properties for sale was € 1,832 per square meter, with an increase of 18.35% compared to March 2024 (1,548 €/m²). Over the past 2 years, the average price in Bétera municipality reached its peak in March 2025, with a value of € 1,832 per square meter. The month with the lowest asking price was June 2023: for a property for sale, the average price asked was € 1,480 per square meter.
In March 2025 the average price asked for residential rental properties was € 14.31 per month per square meter, with an increase of 18.95% compared to March 2024 (€ 12.03 monthly per square meter). Over the past 2 years, the average price in Bétera municipality reached its peak in March 2025, with a value of € 14.31 per square meter. The month with the lowest asking price was October 2024: for a rental property, the average price asked was € 8.93 per month per square meter.
Prices per square meter of the zones in Bétera
During March 2025, the asking price for properties for sale in Bétera was highest in the La Conarda-Montesano area, with € 2,132 per square meter. The lowest price, instead, was in the Centre area, with an average of € 1,487 per square meter.
During the same month, the asking price for rental properties in Bétera was highest in the Torre en Conill-Cumbres San Antonio area, with € 14.76 per month per square meter. The lowest price, instead, was in the Camí de Paterna-Lloma del Calderer area, with an average of € 4.27 per month per square meter.
| Zones | Sale(€/m²) | Rent(€/m²) |
|---|---|---|
| Torre en Conill-Cumbres San Antonio | 1,989 | 14.76 |
| Camí de Paterna-Lloma del Calderer | 1,637 | 4.27 |
| Los Pinares-La Masia | 1,541 | 9.1 |
| Mas Camarena | 1,805 | 8.92 |
| La Conarda-Montesano | 2,132 | 12.85 |
| Centre | 1,487 | 9.14 |


The following charts show information about the real estate property of the municipality of Bétera and a summary of the demographic and socio-economic aspects that characterize its resident population, consisting of 24,604 inhabitants.
75/Km2
Common surface
328 population/Km2
Population density (2020)