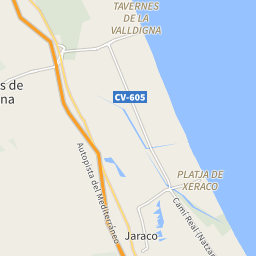
Housing price in the Bulevar del Xúquer-El Maranyet area, Cullera
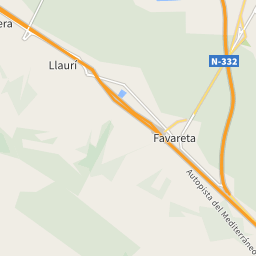
The map shows the average prices of the residential properties in the area Bulevar del Xúquer-El Maranyet in Cullera. The reference period is March 2025.
sale
1,554 €/m²
-
rent
10.15 €/m²
-
Or rely on the experience of a real estate agency
Search agencyProperty prices trend in the zone Bulevar del Xúquer-El Maranyet
The following charts show price trends over time for all types of residential property in the Bulevar del Xúquer-El Maranyet area, both for sale and for rent.
In March 2025 the average price asked for residential properties for sale was € 1,554 per square meter, with an increase of 4.23% compared to March 2024 (1,491 €/m²). Over the past 2 years, the average price in the Bulevar del Xúquer-El Maranyet area reached its peak in the month of September 2024, with a value of € 1,618 per square meter. The month with the lowest asking price was October 2023: for a property for sale, the average price asked was € 1,366 per square meter.
In March 2025 the average price asked for residential rental properties was € 10.15 per month per square meter, with an increase of 15.08% compared to March 2024 (€ 8.82 monthly per square meter). Over the past 2 years, the average price in the Bulevar del Xúquer-El Maranyet area reached its peak in the month of October 2024, with a value of € 10.80 per square meter. The month with the lowest asking price was August 2024: for a rental property, the average price asked was € 8.82 per month per square meter.