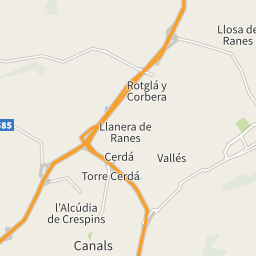
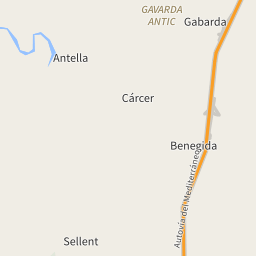
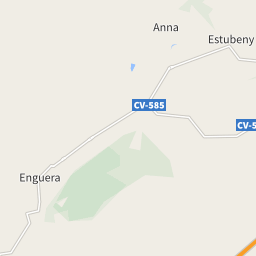
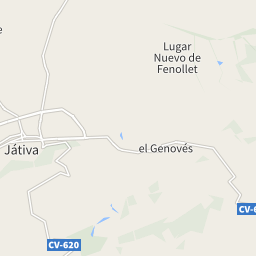
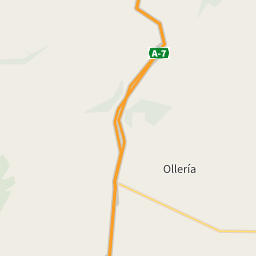
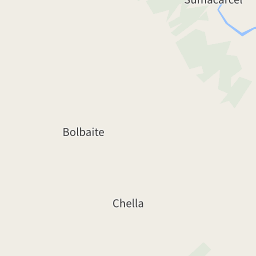
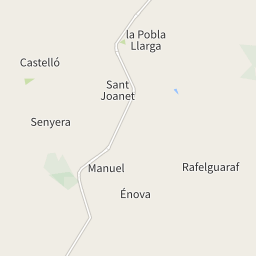
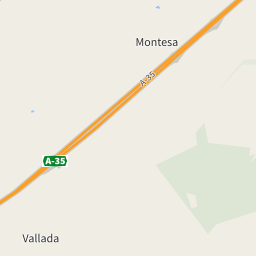
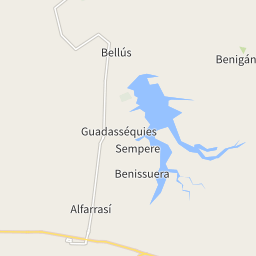
Housing prices in the municipality of Rotglà i Corberà
The map shows the average prices of the residential properties in the municipality of Rotglà i Corberà. The reference period is March 2025.
sale
485 €/m²
from 103 €/m² to 3,831 €/m²
rent
2.34 €/m²
from 1.90 €/m² to 17.40 €/m²
Or rely on the experience of a real estate agency
Search agencyProperty prices trend in Rotglà i Corberà
The following charts show price trends over time for all types of residential property in Rotglà i Corberà, both for sale and for rent.
In March 2025 the average price asked for residential properties for sale was € 485 per square meter, with a decrease of 17.52% compared to March 2024 (588 €/m²). Over the past 2 years, the average price in Rotglà i Corberà municipality reached its peak in May 2023, with a value of € 710 per square meter. The month with the lowest asking price was October 2024: for a property for sale, the average price asked was € 388 per square meter.
In March 2025 the average price asked for residential rental properties was € 2.34 per month per square meter, with an increase of 0.00% compared to March 2024 (€ 2.34 monthly per square meter).
Prices per square meter of the municipalities in the province of València
In March 2025, the asking price for properties for sale in Rotglà i Corberà was € 485 per square meter, compared to the provincial average of € 1,516.
The asking price for rental properties in Rotglà i Corberà was € 2.34 monthly per square meter, compared to the provincial average of € 13.91.
The following charts show information about the real estate property of the municipality of Rotglà i Corberà and a summary of the demographic and socio-economic aspects that characterize its resident population, consisting of 1,117 inhabitants.
6/Km2
Common surface
177 population/Km2
Population density (2020)