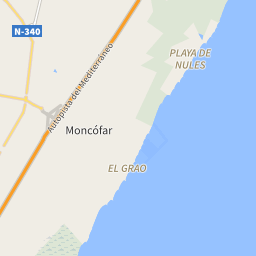
Housing prices in the municipality of Sagunto - Sagunt
The map shows the average prices of the residential properties in the municipality of Sagunto - Sagunt. The reference period is March 2025.
sale
1,392 €/m²
from 1,249 €/m² to 1,858 €/m²
rent
8.98 €/m²
from 8.20 €/m² to 9.39 €/m²
Or rely on the experience of a real estate agency
Search agencyProperty prices trend in Sagunto - Sagunt
The following charts show price trends over time for all types of residential property in Sagunto - Sagunt, both for sale and for rent.
In March 2025 the average price asked for residential properties for sale was € 1,392 per square meter, with an increase of 4.19% compared to March 2024 (1,336 €/m²). Over the past 2 years, the average price in Sagunto - Sagunt municipality reached its peak in October 2024, with a value of € 1,406 per square meter. The month with the lowest asking price was May 2023: for a property for sale, the average price asked was € 1,161 per square meter.
In March 2025 the average price asked for residential rental properties was € 8.98 per month per square meter, with a decrease of 1.10% compared to March 2024 (€ 9.08 monthly per square meter). Over the past 2 years, the average price in Sagunto - Sagunt municipality reached its peak in June 2024, with a value of € 9.19 per square meter. The month with the lowest asking price was May 2023: for a rental property, the average price asked was € 7.66 per month per square meter.
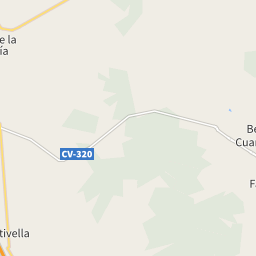
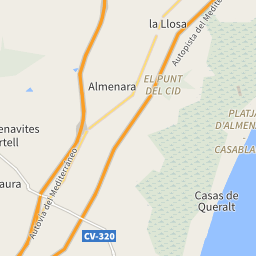
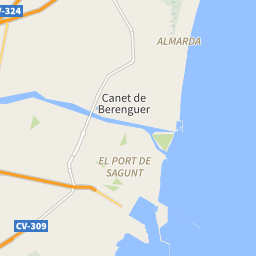
Prices per square meter of the zones in Sagunto - Sagunt
During March 2025, the asking price for properties for sale in Sagunto - Sagunt was highest in the Almardà area, with € 1,858 per square meter. The lowest price, instead, was in the Sagunt Poble area, with an average of € 1,249 per square meter.
During the same month, the asking price for rental properties in Sagunto - Sagunt was highest in the Almardà area, with € 9.39 per month per square meter. The lowest price, instead, was in the Sagunt Poble area, with an average of € 8.20 per month per square meter.
| Zones | Sale(€/m²) | Rent(€/m²) |
|---|---|---|
| Port de Sagunt | 1,430 | 9.13 |
| Sagunt Poble | 1,249 | 8.2 |
| Almardà | 1,858 | 9.39 |


The following charts show information about the real estate property of the municipality of Sagunto - Sagunt and a summary of the demographic and socio-economic aspects that characterize its resident population, consisting of 67,173 inhabitants.
133/Km2
Common surface
507 population/Km2
Population density (2020)