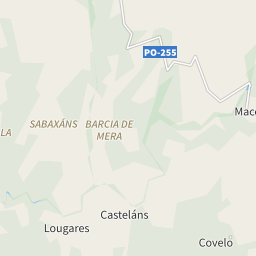
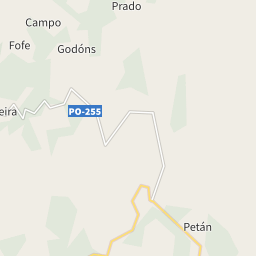
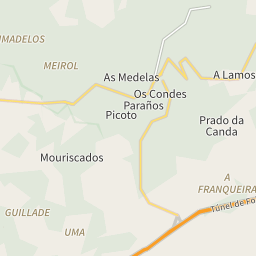
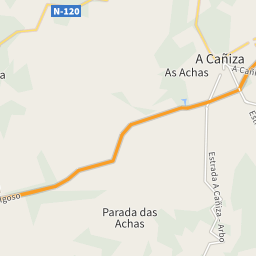
Housing prices in the municipality of Covelo
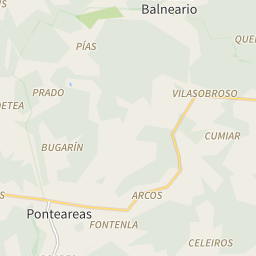
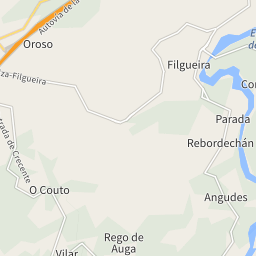
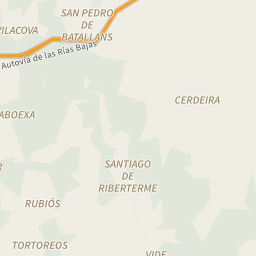
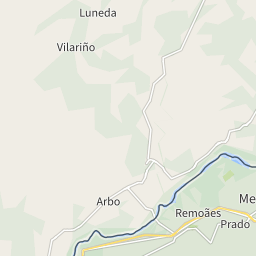
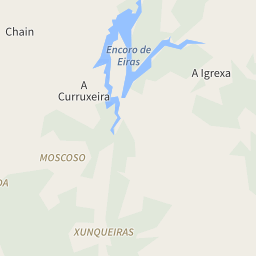
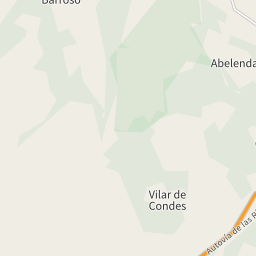
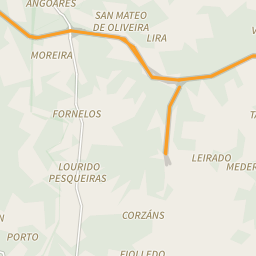
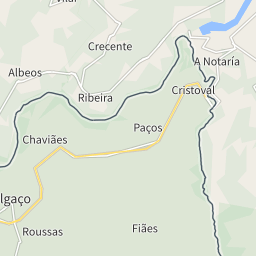
The map shows the average prices of the residential properties in the municipality of Covelo. The reference period is December 2024.
sale
667 €/m²
from 369 €/m² to 2,506 €/m²
rent
0.00 €/m²
from 1.83 €/m² to 22.95 €/m²
Or rely on the experience of a real estate agency
Search agencyProperty prices trend in Covelo
The following charts show price trends over time for all types of residential property in Covelo, both for sale and for rent.
In December 2024 the average price asked for residential properties for sale was € 667 per square meter, with an increase of 31.04% compared to January 2024 (509 €/m²). Over the past 2 years, the average price in Covelo municipality reached its peak in August 2024, with a value of € 675 per square meter. The month with the lowest asking price was November 2023: for a property for sale, the average price asked was € 444 per square meter.
Currently, we do not have enough information on the prices per square meter asked for rental properties in the municipality of Covelo; we therefore encourage you to return to this page periodically.
Prices per square meter of the municipalities in the province of Pontevedra
In December 2024, the asking price for properties for sale in Covelo was € 667 per square meter, compared to the provincial average of € 1,637.
| Municipalities | Sale(€/m²) | Rent(€/m²) |
|---|---|---|
| Pontevedra | 1,877 | 8.43 |
| A Cañiza | 642 | - |
| A Estrada | 743 | 3.17 |
| A Guarda | 906 | 6.79 |
| A Illa de Arousa | 2,403 | 4.41 |
| A Lama | 554 | - |
| Agolada | 372 | - |
| Arbo | 630 | - |
| As Neves | 738 | 1.83 |
| Baiona | 1,726 | 8.91 |
| Barro | 821 | 3.69 |
| Bueu | 1,407 | 11.07 |
| Caldas de Reis | 786 | 5.31 |
| Cambados | 1,258 | 5.48 |
| Campo Lameiro | 548 | - |
| Cangas | 2,016 | 7.17 |
| Catoira | 604 | - |
| Cerdedo-Cotobade | 743 | - |
| Covelo | 667 | - |
| Crecente | 472 | - |
| Cuntis | 1,097 | 3.13 |
| Dozón | - | - |
| Forcarei | 414 | - |
| Fornelos de Montes | 615 | - |
| Gondomar | 1,301 | 4.63 |
| Lalín | 745 | 5.53 |
| Marín | 1,021 | 5.86 |
| Meaño | 1,289 | 2.96 |
| Meis | 1,146 | 5.08 |
| Moaña | 1,237 | 8.88 |
| Mondariz | 976 | - |
| Mondariz-Balneario | 1,319 | 5.43 |
| Moraña | 708 | 3.26 |
| Mos | 1,095 | 6.5 |
| Nigrán | 2,299 | 8.77 |
| O Grove | 2,506 | 12.24 |
| O Porriño | 1,556 | 6.93 |
| O Rosal | 847 | 3.45 |
| Oia | 923 | 4.38 |
| Pazos de Borbén | 605 | - |
| Poio | 1,597 | 7.92 |
| Ponte Caldelas | 751 | 3.14 |
| Ponteareas | 955 | 5.38 |
| Pontecesures | 745 | 3.69 |
| Portas | 539 | - |
| Redondela | 1,166 | 7.69 |
| Ribadumia | 1,340 | 4.3 |
| Rodeiro | 369 | - |
| Salceda de Caselas | 919 | 6.54 |
| Salvaterra de Miño | 1,131 | 5.6 |
| Sanxenxo | 2,393 | 22.95 |
| Silleda | 676 | 3.9 |
| Soutomaior | 1,496 | 7.87 |
| Tomiño | 909 | 3.09 |
| Tui | 1,077 | 6.26 |
| Valga | 1,303 | - |
| Vigo | 2,282 | 10.28 |
| Vila de Cruces | 759 | 2.49 |
| Vilaboa | 959 | 2.46 |
| Vilagarcía de Arousa | 1,396 | 7.8 |
| Vilanova de Arousa | 1,316 | 6.06 |
The following charts show information about the real estate property of the municipality of Covelo and a summary of the demographic and socio-economic aspects that characterize its resident population, consisting of 2,368 inhabitants.
126/Km2
Common surface
19 population/Km2
Population density (2020)