Housing prices in the municipality of O Barco de Valdeorras
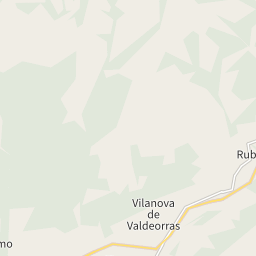
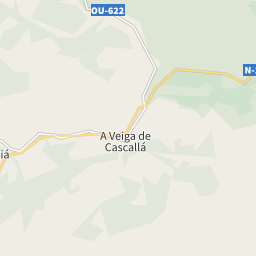
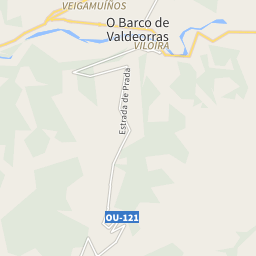
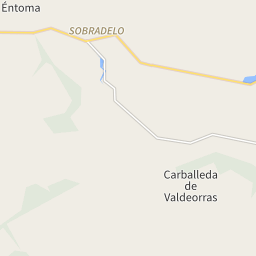
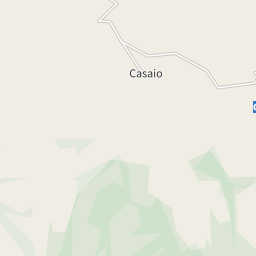
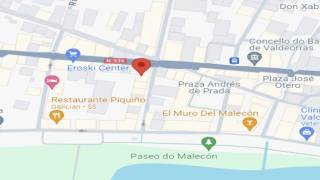
The map shows the average prices of the residential properties in the municipality of O Barco de Valdeorras. The reference period is December 2024.
sale
570 €/m²
from 146 €/m² to 1,358 €/m²
rent
4.63 €/m²
from 2.05 €/m² to 7.65 €/m²
Or rely on the experience of a real estate agency
Search agencyProperty prices trend in O Barco de Valdeorras
The following charts show price trends over time for all types of residential property in O Barco de Valdeorras, both for sale and for rent.
In December 2024 the average price asked for residential properties for sale was € 570 per square meter, with a decrease of 22.66% compared to January 2024 (737 €/m²). Over the past 2 years, the average price in O Barco de Valdeorras municipality reached its peak in March 2024, with a value of € 745 per square meter. The month with the lowest asking price was October 2024: for a property for sale, the average price asked was € 547 per square meter.
In December 2024 the average price asked for residential rental properties was € 4.63 per month per square meter, with an increase of 0.00% compared to January 2024 (€ 4.63 monthly per square meter). Over the past 2 years, the average price in O Barco de Valdeorras municipality reached its peak in December 2024, with a value of € 4.63 per square meter. The month with the lowest asking price was March 2023: for a rental property, the average price asked was € 4.62 per month per square meter.
Prices per square meter of the municipalities in the province of Ourense
In December 2024, the asking price for properties for sale in O Barco de Valdeorras was € 570 per square meter, compared to the provincial average of € 1,004.
The asking price for rental properties in O Barco de Valdeorras was € 4.63 monthly per square meter, compared to the provincial average of € 7.51.
The following charts show information about the real estate property of the municipality of O Barco de Valdeorras and a summary of the demographic and socio-economic aspects that characterize its resident population, consisting of 13,431 inhabitants.
86/Km2
Common surface
156 population/Km2
Population density (2020)