Housing prices in the municipality of Gernika-Lumo

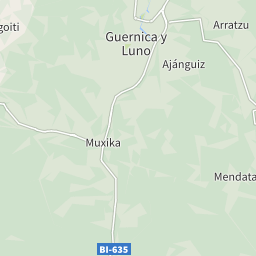
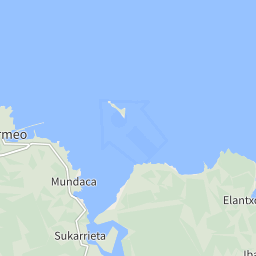
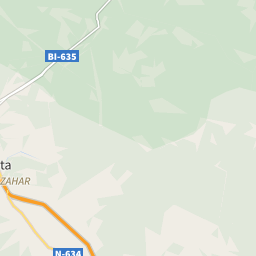
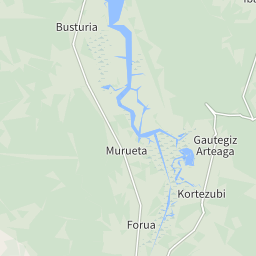
The map shows the average prices of the residential properties in the municipality of Gernika-Lumo. The reference period is March 2025.

sale

2,291 €/m²

from 579 €/m² to 4,019 €/m²

rent

6.85 €/m²

from 1.76 €/m² to 16.96 €/m²

Or rely on the experience of a real estate agency

Search agency

Property prices trend in Gernika-Lumo

The following charts show price trends over time for all types of residential property in Gernika-Lumo, both for sale and for rent.

Average price sale (€/m²)
1,800 €
1,900 €
2,000 €
2,100 €
2,200 €
2,300 €
2,400 €
2017
2018
2019
2020
2021
2022
2023
2024
2025

In March 2025 the average price asked for residential properties for sale was € 2,291 per square meter, with an increase of 0.44% compared to March 2024 (2,281 €/m²). Over the past 2 years, the average price in Gernika-Lumo municipality reached its peak in December 2024, with a value of € 2,352 per square meter. The month with the lowest asking price was May 2024: for a property for sale, the average price asked was € 2,156 per square meter.

Average price rent (€/m²)
3 €
4 €
5 €
6 €
7 €
8 €
9 €
10 €
2017
2018
2019
2020
2021
2022
2023
2024
2025

In March 2025 the average price asked for residential rental properties was € 6.85 per month per square meter, with an increase of 0.00% compared to March 2024 (€ 6.85 monthly per square meter).

Prices per square meter of the municipalities in the province of Vizcaya - Bizkaia

In March 2025, the asking price for properties for sale in Gernika-Lumo was € 2,291 per square meter, compared to the provincial average of € 2,970.
The asking price for rental properties in Gernika-Lumo was € 6.85 monthly per square meter, compared to the provincial average of € 16.15.

MunicipalitiesSale(€/m²)Rent(€/m²)
Bilbao3,72016.96
Abadiño2,2339.41
Abanto-Zierbena2,19910.86
Ajangiz633-
Alonsotegi2,0149.71
Amorebieta-Etxano2,2539.34
Amoroto--
Arakaldo1,456-
Arantzazu1,695-
Areatza1,426-
Arrankudiaga1,060-
Arratzu1,049-
Arrieta1,5985.88
Arrigorriaga2,4279.69
Artea1,209-
Artzentales1,0241.76
Atxondo1,853-
Aulesti974-
Bakio3,4269.48
Balmaseda1,7548.98
Barakaldo2,71812.71
Barrika3,43212.45
Basauri2,40310.7
Bedia1,067-
Berango3,59613.32
Bermeo1,9627.56
Berriatua2,448-
Berriz1,7018.17
Busturia1,52610.87
Derio2,57210.39
Dima1,150-
Durango2,78311.92
Ea1,6745.28
Elantxobe--
Elorrio2,4746.56
Erandio2,72711.74
Ereño--
Ermua2,05410.19
Errigoiti1,053-
Etxebarri2,7598.9
Etxebarria698-
Forua1,894-
Fruiz1,644-
Galdakao2,6189.21
Galdames1,253-
Gamiz-Fika1,2363.97
Garay1,446-
Gatika1,6967.67
Gautegiz Arteaga2,203-
Gernika-Lumo2,2916.85
Getxo4,01916.27
Gizaburuaga1,371-
Gordexola1,4753.39
Gorliz2,87611.05
Güeñes1,8788.43
Ibarrangelu2,286-
Igorre1,7325.85
Ispaster2,362-
Iurreta2,5637.43
Izurtza1,321-
Karrantza Harana68810.54
Kortezubi--
Lanestosa662-
Larrabetzu1,2288.05
Laukiz1,6877.47
Leioa3,52314.9
Lekeitio3,7569.91
Lemoa1,8938.88
Lemoiz1,9747.12
Lezama1,8386.79
Loiu2,4876.1
Mallabia746-
Mañaria1,763-
Markina-Xemein1,413-
Maruri-Jatabe1,6403.57
Meñaka975-
Mendata--
Mendexa1,520-
Morga703-
Mundaka2,2358.35
Mungia2,2465.9
Munitibar-Arbatzegi-Gerrikaitz856-
Murueta--
Muskiz2,3588.55
Muxika1,725-
Nabarniz1,280-
Ondarroa2,092-
Orozko1,7474.64
Ortuella2,1428.95
Otxandio1,5185.42
Plentzia3,39410.84
Portugalete2,61514.75
Santurtzi2,54111.67
Sestao2,30011.19
Sondika2,6228.84
Sopela3,80113.79
Sopuerta1,0455.74
Sukarrieta1,152-
Trapagaran2,0119.22
Trucios - Turtzioz579-
Ubide716-
Ugao-Miraballes1,4678.32
Urduliz3,06214.62
Urduña - Orduña1,178-
Zaldibar1,8168.2
Zalla2,1669.65
Zamudio2,55810.08
Zaratamo898-
Zeanuri845-
Zeberio1,435-
Zierbena3,454-
Ziortza-Bolibar1,245-
Real estate agencies in the municipality of Gernika-Lumo
Socio-demographic data in the municipality of Gernika-Lumo

The following charts show information about the real estate property of the municipality of Gernika-Lumo and a summary of the demographic and socio-economic aspects that characterize its resident population, consisting of 17,105 inhabitants.

Total Dwellings: 9,356 (2020)
0
1 K
1 K
2 K
2 K
3 K
94
-1920
-1920
1,123
'21-'50
'21-'50
748
'51-'60
'51-'60
2,152
'61-'70
'61-'70
1,684
'71-'80
'71-'80
842
'81-'90
'81-'90
1,029
'91-'01
'91-'01
1,684
2002-
2002-
Population: 17,105 (2020)
16,700
16,750
16,800
16,850
16,900
16,950
17,000
17,050
17,100
17,150
2015
2017
2019
Common surface

8/Km2

Common surface

Population density

2,015 population/Km2

Population density (2020)
Percentage of population by age group. Average age: 44.54 years (2020)
0 %
5 %
10 %
15 %
20 %
25 %
30 %
35 %
40 %
10 %
<10
<10
10 %
10-19
10-19
14 %
20-34
20-34
37 %
35-59
35-59
17 %
60-74
60-74
12 %
75+
75+
© OpenStreetMap contributors
< 1,000 €/m²> 2,800 €/m²