Housing prices in the municipality of Oyón - Oion
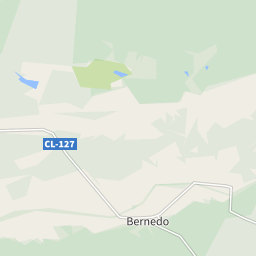
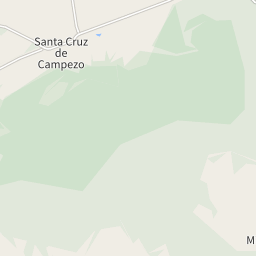
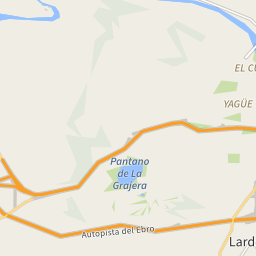
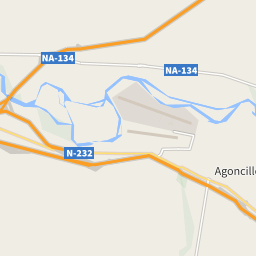
The map shows the average prices of the residential properties in the municipality of Oyón - Oion. The reference period is March 2025.
sale
1,055 €/m²
from 225 €/m² to 2,694 €/m²
rent
0.00 €/m²
from 4.03 €/m² to 10.16 €/m²
Or rely on the experience of a real estate agency
Search agencyProperty prices trend in Oyón - Oion
The following charts show price trends over time for all types of residential property in Oyón - Oion, both for sale and for rent.
In March 2025 the average price asked for residential properties for sale was € 1,055 per square meter, with a decrease of 10.37% compared to April 2024 (1,177 €/m²). Over the past 2 years, the average price in Oyón - Oion municipality reached its peak in May 2024, with a value of € 1,230 per square meter. The month with the lowest asking price was June 2023: for a property for sale, the average price asked was € 953 per square meter.
Currently, we do not have enough information on the prices per square meter asked for rental properties in the municipality of Oyón - Oion; we therefore encourage you to return to this page periodically.
Prices per square meter of the municipalities in the province of Álava - Araba
In March 2025, the asking price for properties for sale in Oyón - Oion was € 1,055 per square meter, compared to the provincial average of € 2,424.


The following charts show information about the real estate property of the municipality of Oyón - Oion and a summary of the demographic and socio-economic aspects that characterize its resident population, consisting of 3,410 inhabitants.
45/Km2
Common surface
76 population/Km2
Population density (2020)