Housing prices in the municipality of Alguazas
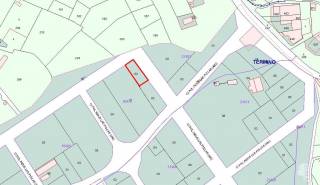
The map shows the average prices of the residential properties in the municipality of Alguazas. The reference period is December 2024.
sale
583 €/m²
from 375 €/m² to 2,699 €/m²
rent
3.67 €/m²
from 2.60 €/m² to 18.74 €/m²
Or rely on the experience of a real estate agency
Search agencyProperty prices trend in Alguazas
The following charts show price trends over time for all types of residential property in Alguazas, both for sale and for rent.
In December 2024 the average price asked for residential properties for sale was € 583 per square meter, with an increase of 4.48% compared to January 2024 (558 €/m²). Over the past 2 years, the average price in Alguazas municipality reached its peak in October 2024, with a value of € 592 per square meter. The month with the lowest asking price was September 2023: for a property for sale, the average price asked was € 538 per square meter.
In December 2024 the average price asked for residential rental properties was € 3.67 per month per square meter, with a decrease of 6.62% compared to January 2024 (€ 3.93 monthly per square meter). Over the past 2 years, the average price in Alguazas municipality reached its peak in May 2023, with a value of € 5.00 per square meter. The month with the lowest asking price was May 2024: for a rental property, the average price asked was € 3.42 per month per square meter.
Prices per square meter of the municipalities in the province of Murcia
In December 2024, the asking price for properties for sale in Alguazas was € 583 per square meter, compared to the provincial average of € 1,723.
The asking price for rental properties in Alguazas was € 3.67 monthly per square meter, compared to the provincial average of € 8.58.
| Municipalities | Sale(€/m²) | Rent(€/m²) |
|---|---|---|
| Murcia | 1,572 | 8.87 |
| Abanilla | 1,164 | 3.28 |
| Abarán | 647 | 2.6 |
| Águilas | 1,591 | 8.33 |
| Albudeite | 497 | - |
| Alcantarilla | 942 | 6.51 |
| Aledo | 1,047 | - |
| Alguazas | 583 | 3.67 |
| Alhama de Murcia | 1,963 | 8.04 |
| Archena | 757 | 5.06 |
| Beniel | 741 | 5.17 |
| Blanca | 678 | 2.65 |
| Bullas | 543 | - |
| Calasparra | 2,699 | 3.8 |
| Campos del Río | 450 | - |
| Caravaca de La Cruz | 660 | 3.61 |
| Cartagena | 1,786 | 7.76 |
| Cehegín | 471 | 4.35 |
| Ceutí | 685 | 6.04 |
| Cieza (Murcia) | 735 | 4.57 |
| Fortuna | 1,454 | 3.2 |
| Fuente Álamo de Murcia | 1,114 | 4.54 |
| Jumilla | 793 | 4.38 |
| La Manga del Mar Menor | 1,987 | 16.4 |
| La Unión | 951 | 6.48 |
| Las Torres de Cotillas | 825 | 6.77 |
| Librilla | 682 | 2.62 |
| Lorca | 1,181 | 6.74 |
| Lorquí | 787 | 5.32 |
| Los Alcázares | 2,610 | 8.07 |
| Mazarrón | 1,636 | 18.74 |
| Molina de Segura | 1,293 | 6.57 |
| Moratalla | 530 | - |
| Mula | 838 | 3.32 |
| Ojós | 902 | - |
| Pliego | 621 | - |
| Puerto Lumbreras | 921 | 3.75 |
| Ricote | 831 | - |
| San Javier | 2,421 | 8 |
| San Pedro del Pinatar | 2,490 | 9.69 |
| Santomera | 965 | 5.61 |
| Torre-Pacheco | 2,639 | 8.54 |
| Totana | 1,093 | 4.17 |
| Ulea | 375 | - |
| Villanueva del Río Segura | 1,140 | 5.83 |
| Yecla | 950 | 3.88 |
The following charts show information about the real estate property of the municipality of Alguazas and a summary of the demographic and socio-economic aspects that characterize its resident population, consisting of 9,761 inhabitants.
24/Km2
Common surface
410 population/Km2
Population density (2020)